The Road We’re On if We Don’t Take a Different Route


Recent trends suggest a shift away from coal and toward natural gas and renewables in the region, but the shift does not result in decarbonization.
We use sophisticated computer models to help us understand where the electricity sector is likely to go without policies to reduce carbon emissions. Because the future is uncertain, we vary individual factors–like natural gas prices or the cost of renewables–to help understand the effect they are likely to have on the system in the future.
The Midcontinent Power Sector Collaborative (MPSC) engaged the developers of the FACETS model to conduct analyses of the region’s power sector. The MPSC ran dozens of scenarios to better understand what the future holds for carbon emissions from the region’s electricity sector with and without new policies or actions to reduce emissions.
The result? None of the modeled futures—across a wide range of assumptions—results in significant decarbonization of the electricity sector by 2050 without policy intervention and other actions. Emissions in the low gas price scenario drop significantly by 2030—by about 29 percent from 2016 levels—and then level off through 2050. Emissions in the low renewables cost scenario drop less significantly—about 9 percent—and then slowly and modestly decrease through 2050.

Carbon Emissions are Expected to Decline, But Not Enough without New Actions
The graphic below shows the range of possible futures according to the model, depicted in the grey area on the chart. The two lines represent what the participants in the Midcontinent Power Sector Collaborative determined are the most likely future scenarios given the assumptions that went into those analyses. In a nutshell, emissions are expected to maintain the recent trend and continue declining, but not enough to meet our environmental obligations.
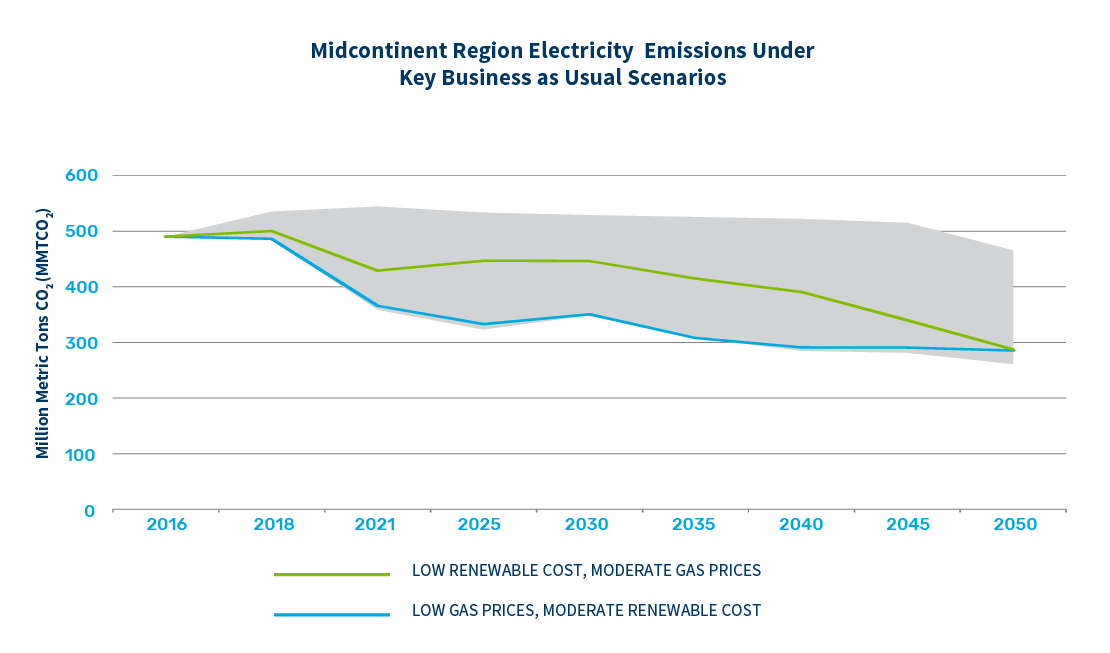
So why the wide range of possible futures? The key variables are natural gas prices, the cost of renewables, and whether existing nuclear plants continue operating until midcentury. When we change one or more of those key variables, the system reacts differently over time to give us different modeled outcomes. For example, we see below the difference between the two scenarios represented by the blue and green lines in the emissions chart above.
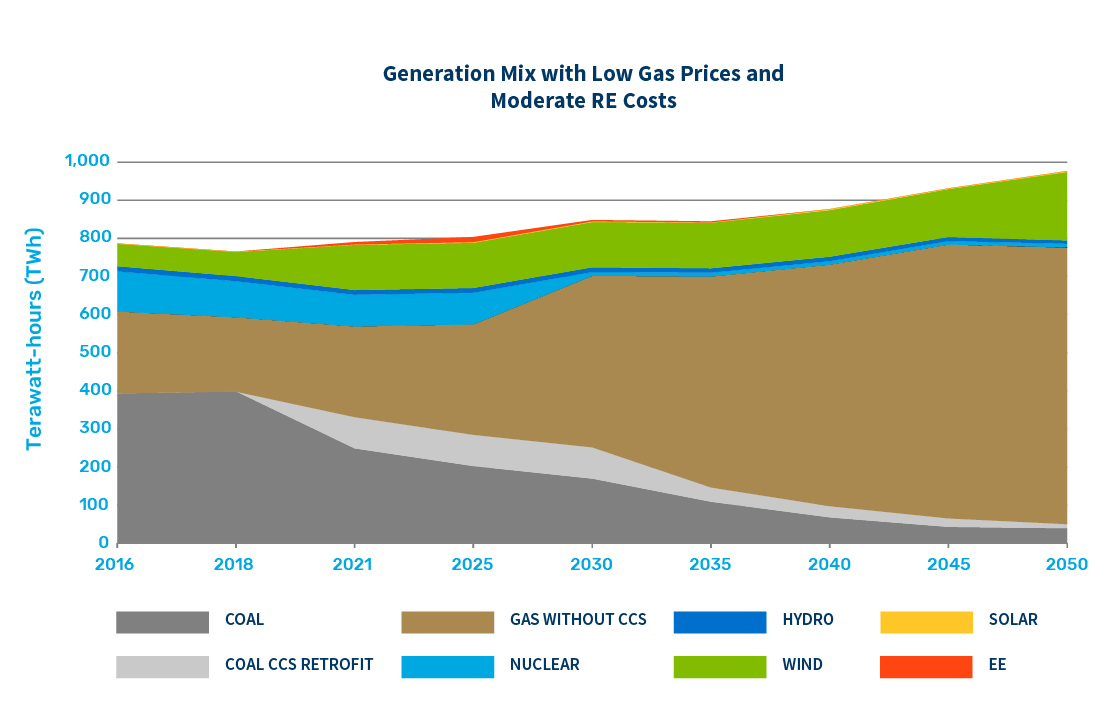
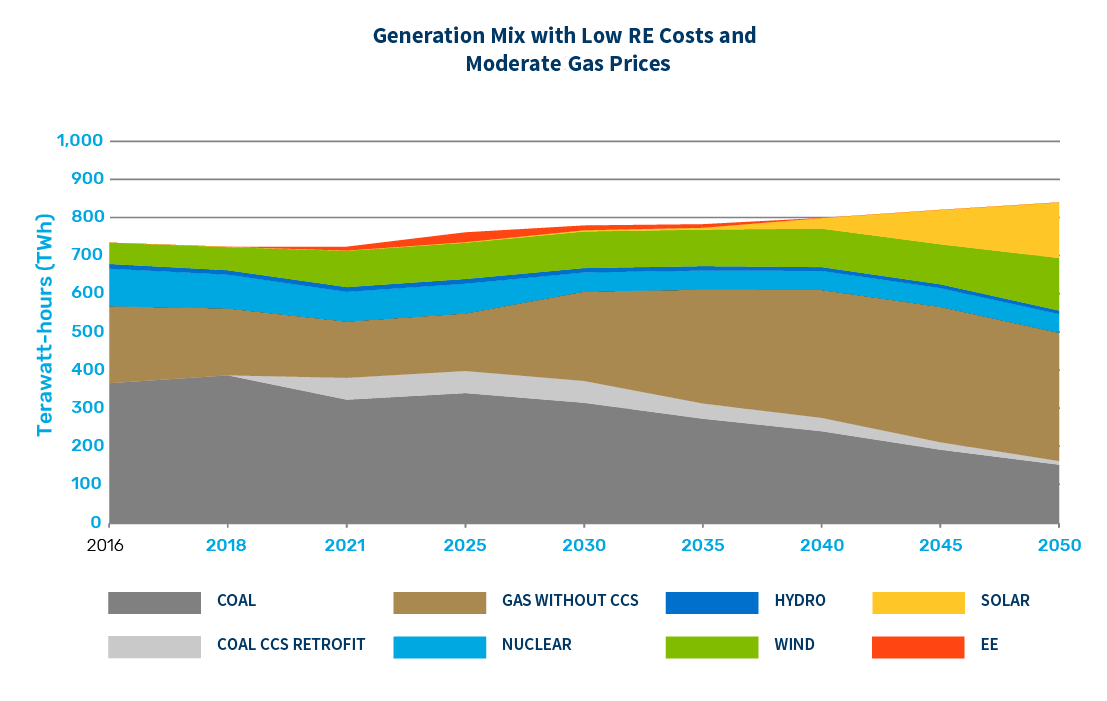
In the first graph below, we see a future heavily dominated by natural gas, shown as the brown share of the generation mix out to 2050, with nuclear retiring for economic reasons and very little solar. This is what we might project to happen if gas prices stay very low and renewables costs are moderate. The second graph below shows a more mixed future with increased renewables, some increased natural gas, and the retention of more existing nuclear power.
Once we understand what the future might look like without a carbon constraint, we can apply a limit on carbon emissions in the model to see how the electricity system reacts. See these results under “Pathways” in this road map.
The results of the modeling analysis are available to explore in greater detail below. The interface is provided by the MPSC’s modeling consultants and shows FACETS results.